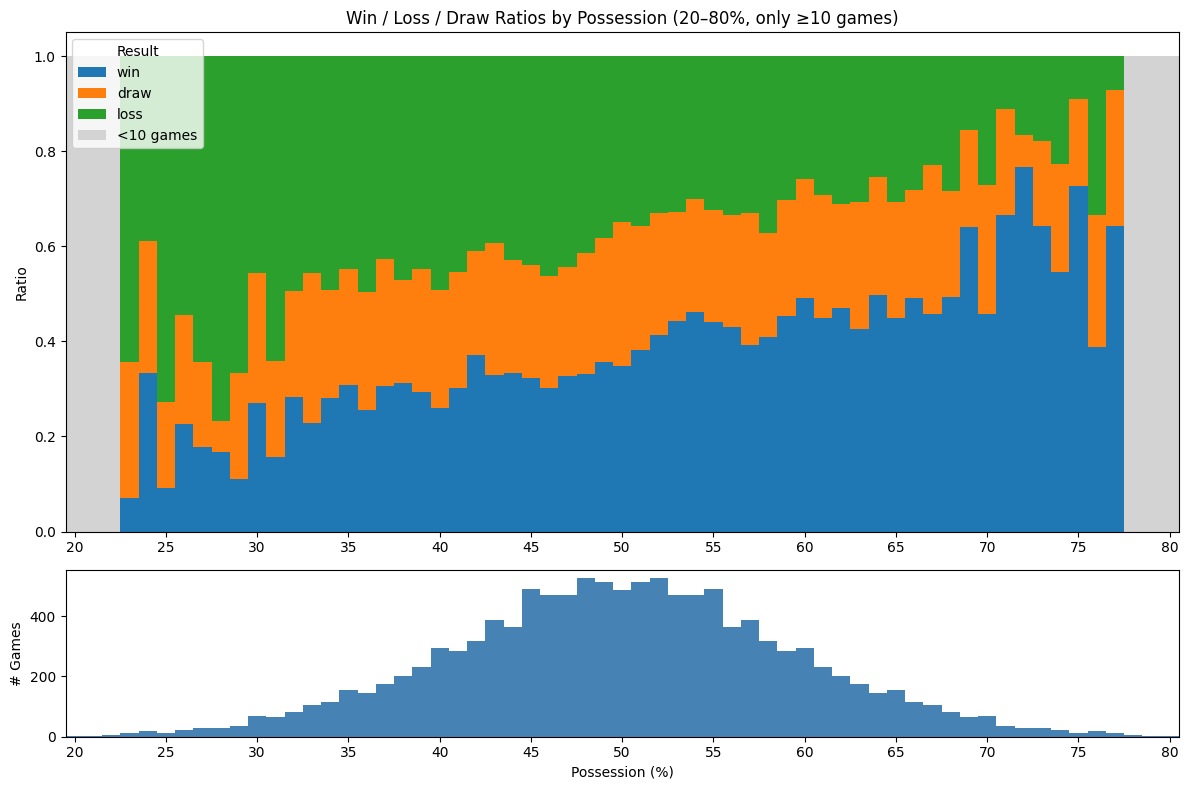
Was chatting with a friend about how possession impacts results in soccer and hacked up a quick plot. Data is sourced from Kaggle.
There’s a clear increase in win-percentage as possession goes up, which would be expected, however draws stay somewhat constant.
- Carter
Code:
from pprint import pprint
import matplotlib.pyplot as plt
import xml.etree.ElementTree as ET
from collections import defaultdict
import numpy as np
import sqlite3
import pandas as pd

conn = sqlite3.connect("data/database.sqlite")
df = pd.read_sql_query("SELECT * FROM Match;", conn)
conn.close()

results = defaultdict(lambda: {'win': 0, 'loss': 0, 'draw': 0})

for _, row in df.iterrows():
    if not row['possession']:
        continue
    for value in ET.fromstring(row['possession']).findall("value"):
        if value.findtext("elapsed") == '90':
            home_pos, away_pos = value.findtext("homepos"), value.findtext("awaypos")
            if not home_pos or not away_pos:
                continue
            home_goals, away_goals = row['home_team_goal'], row['away_team_goal']
            if home_goals > away_goals:
                results[home_pos]['win'] += 1
                results[away_pos]['loss'] += 1
            elif home_goals < away_goals:
                results[home_pos]['loss'] += 1
                results[away_pos]['win'] += 1
            else:
                results[home_pos]['draw'] += 1
                results[away_pos]['draw'] += 1

df = pd.DataFrame.from_dict(results, orient="index").astype(float)
df.index = df.index.astype(int)

full_index = pd.Index(range(20, 81), name="possession")
df = df.reindex(full_index)

df["total_games"] = df.sum(axis=1)
valid_mask = df["total_games"] >= 10
df_ratio = df.div(df[["win", "loss", "draw"]].sum(axis=1), axis=0)
df_ratio[~valid_mask] = np.nan

fig, (ax1, ax2) = plt.subplots(2, 1, figsize=(12, 8), sharex=True, gridspec_kw={"height_ratios": [3, 1]})

x_positions = np.arange(len(df.index))

order = ["win", "draw", "loss"]
colors = ["#1f77b4", "#ff7f0e", "#2ca02c"]
bottom = np.zeros(len(df.index))

for i, col in enumerate(order):
    values = df_ratio[col].fillna(0).values
    ax1.bar(x_positions, values, bottom=bottom, width=1.0, label=col, color=colors[i])
    bottom += values

no_data_mask = df_ratio.isna().all(axis=1)
if no_data_mask.any():
    ax1.bar(x_positions[no_data_mask], [1]*no_data_mask.sum(),
            color="lightgray", width=1.0, label="<10 games")

ax1.set_ylabel("Ratio")
ax1.set_title("Win / Loss / Draw Ratios by Possession (20–80%, only ≥10 games)")
ax1.legend(title="Result")

tick_positions = [i for i, val in enumerate(df.index) if val % 5 == 0]
tick_labels = [val for val in df.index if val % 5 == 0]
ax1.set_xticks(tick_positions)
ax1.set_xticklabels(tick_labels)
ax1.set_xlim(-0.5, len(df.index) - 0.5)
ax1.tick_params(labelbottom=True)

ax2.bar(x_positions, df["total_games"].fillna(0), color="steelblue", width=1.0)
ax2.set_ylabel("# Games")
ax2.set_xlabel("Possession (%)")
ax2.set_xticks(tick_positions)
ax2.set_xticklabels(tick_labels)
ax2.set_xlim(-0.5, len(df.index) - 0.5)

plt.tight_layout()
plt.show()